OBSERVATIONAL STUDIES
Participants in observational studies are observed and certain outcomes are measured, without external manipulation or an attempt to affect the outcome.
Descriptive Studies
Many of the studies currently being done in dermatology are descriptive. These include case reports and case series. A case report is a detailed description of an individual patient’s demographics, clinical presentation, diagnosis, treatment, and disease course. A case series reports on some aspect(s) of a disease, diagnostic procedure, or treatment in a group of patients with common characteristics. Case reports and series are useful for determining the manifestations of rare conditions, reporting the preliminary outcomes of experimental therapies, and generating hypotheses for larger studies. A major limitation of case series is the lack of a control group (Table 123.4), although previous data (e.g. on the prevalence of risk factors in the general population) can sometimes be utilized for comparison.
An example of a valuable case series is the description of scalp involvement in patients with dermatomyositis by Kasteler and Callen. Fourteen of the 17 patients with dermatomyositis who were
(LGBT) patients. HIV, human immunodeficiency virus; STDs, sexually transmitted diseases.
seen in the authors’ practice over a 5-year period had scalp involvement, manifesting as atrophic, erythematous, scaly plaques. Five of the 14 affected individuals had previously been diagnosed with scalp psoriasis or seborrheic dermatitis. This study helped raise awareness of scalp involvement as a manifestation of dermatomyositis.
Using Epidemiology to Identify the Cause of Disease
Case–control, cohort, and cross-sectional studies are often performed to help elucidate the etiology and risk factors of a disease (see Table 123.4). These methods involve studying a disease of interest (e.g. cutaneous SCC) and an exposure that is suspected of being a risk factor for the disease (e.g. ultraviolet [UV] radiation), so that the study participants can be categorized as having the disease or not and as being exposed to the potential risk factor or not (Table 123.5).
Case–control study
A case–control study identifies a group of individuals with a disease, as well as a comparison group without the disease from the same population. The study design retrospectively evaluates the level of exposure in the disease group (cases), as compared to that in the group without disease (controls). To ensure that those with disease and without are comparable, both types of participants should be sampled from a single population and data collected in the same way for each group. In addition, cases and controls should be matched on possible confounding factors; for example, if there is a 60-year-old female case, then a 60-year-old female control from the same general population would be selected.
A confounder is an extraneous variable that is associated with both the exposure and the disease being studied; it could therefore account for a part or all of the relationship between the exposure and disease. Although the confounder may be a contributing factor to the disease, it is not caused by the exposure and thus is not along the “causal pathway” between the exposure and disease (Fig. 123.2). Age and sex are examples of possible confounders. These and other characteristics that may be associated with both the exposure and the disease should also be recorded and placed in the statistical model. If an association remains after accounting for confounders, it is more likely to be a true one.
In a case–control study, one can calculate the odds of having had the exposure among those with disease (a/c), as compared to the odds of having had the exposure among those without disease (b/d) (see Table 123.5). The association measure used for case–control studies is an odds ratio (OR), which equals (a/c)/(b/d) or ad/bc. An OR = 1 denotes a null association, whereas an OR statistically significantly greater or less than 1 indicates a positive or negative association, respectively. An OR is different from a relative risk (RR), the rate of disease among those exposed divided by that among those unexposed, (a/a+b)/(c/c+d) (see Cohort study section below). While the RR cannot be directly calculated from a case–control study, the OR approximates the RR when the disease is rare.
One of the major advantages of a case–control study is that it can yield information on a disease with many possible predictors, yet use only a limited number of participants. Therefore, it is well-suited for the investigation of rare conditions. Also, these studies are relatively inexpensive and time-efficient. One of the disadvantages of a case– control study is that it is not clear if the exposure preceded the disease, so causality cannot be established. In addition, this type of study has several potential biases. Sampling bias can occur when cases and controls are collected separately and may not be comparable. Because of the retrospective ascertainment of exposure, recall bias can occur; for example, those with disease may recall the exposure with greater detail because they have been contemplating the potential causes of their condition. Of note, a case–control study does not yield information on the incidence or prevalence of a disease.
An example of a case–control study is that by Picard et al., which examined the association between psoriasis (here the “exposure”) and coronary artery disease. They compared the prevalence of psoriasis in
case patients referred to a cardiologist for coronary artery disease (CAD; confirmed by angiography) to that in age- and sex-matched control patients without CAD (lack of history or symptoms; no Q wave on electrocardiogram) who were referred to a surgeon for a non-cardiovascular condition. The investigators found that psoriasis was present in 8.0% of cases and 3.4% of controls, with an OR of 2.64 (95% confidence interval [CI], 1.42–4.88). In other words, those with CAD had 2.64 times greater odds of having psoriasis, when compared to those without CAD. The 95% CI does not include 1, signifying that the OR is statistically significant (Fig. 123.3). However, upon adjusting for potentially confounding cardiovascular risk factors in multivariate analysis, the OR decreased to 1.84 (95% CI, 0.99–3.40), which includes 1 and is therefore only of borderline significance.
Cohort study
A cohort study recruits its participants from the general population, and those recruited must be without the disease of interest. Using the example given in Table 123.5, all participants would need to be
SCC-free at the onset of the study. They are then categorized as having or not having high-dose UV exposure and are followed over time. At the end of the study, one can calculate the rate of cutaneous SCC among those with high-dose UV exposure (a/a+b) and compare it to the rate of SCC among those without high-dose UV exposure (c/c+d). Therefore, a cohort study compares the incidence of disease between those exposed and not exposed to particular risk factor(s). This is usually expressed in terms of a RR (see definition above). Similar to an OR, a RR of 1 represents a null association, whereas a RR statistically significantly greater or less than 1 indicates a positive or negative association, respectively. A cohort study can be done prospectively, allowing for more control over measuring outcomes (preferred particularly for fatal diseases), or retrospectively, which is less expensive and requires less time.
One of the advantages of a cohort study is that it can determine the incidence of a disease, which is the number of new cases divided by the total number of people at risk in a particular population (e.g. participants in the study) over a specified time period (e.g. length of study). It also gives information on the natural history of a disease, since it captures data from the time of disease onset. Another advantage is that a cohort study establishes temporality, as the exposure precedes the outcome, and therefore allows for causal inference between the exposure and disease. The disadvantages are that a cohort study often requires a large sample size and is less feasible for rare outcomes.
A cohort study by Zhang et al. looked at the association between tanning bed use and development of skin cancers. Their study population included >70 000 female nurses who were followed between 1989 and 2009. After adjusting for possible confounders (e.g. age, skin type, sun exposure, UV index at place of residence), they found that for an incremental increase of 4 sessions/year in mean use of tanning beds prior to age 35 years, the RR of developing BCC was 1.15 (95% CI, 1.11 to 1.19). Thus, the use of tanning beds a mean of 4 or 8 times per year resulted in a ~15% or ~30% higher risk of BCC, respectively, compared to not using tanning beds. This demonstrates a “dose response” effect, i.e. women who used tanning beds more often had a higher skin cancer risk. Furthermore, the authors noted that women exposed to tanning beds in their teenage or college years were at higher risk than those exposed later in life.
Effect modification or interaction occurs when the association between the exposure and disease varies across levels of a variable (e.g. age; Fig. 123.4). Therefore, the exposure and effect modifier have an interdependent role in their effect on the disease. When this happens, the association between exposure and disease should be displayed at various levels or strata of the effect modifier.
Cross-sectional study
A cross-sectional study is similar to a cohort study, except that the initial population does not need to be free of the disease of interest and both the exposure and disease are measured at a single time point, without a follow-up period. It yields information on the prevalence of disease, which is the number of affected individuals divided by the number of people in the population at risk (e.g. total number of study participants),
at a given time. It allows one to study the association between exposure and disease, but it does not provide information about which preceded the other. Cross-sectional study results are often expressed in terms of ORs or relative prevalence, which compares the prevalence rate of a disease among those exposed to that among the unexposed. While mathematically it is represented by (a/a+b)/(c/c+d) (see Table 123.5), here a/a+b and c/c+d are prevalence rates, rather than incidence rates, as in a cohort study.
The advantages of a cross-sectional study are that it is relatively fast, inexpensive, and does not require follow-up. It is the only epidemiologic study that gives the prevalence of a disease, exposure, or other risk factor. One of its weaknesses is that it does not demonstrate temporality, and so it cannot establish a causal relationship between the exposure and disease. Also, it is not practical for rare diseases or rare exposures, which would require a very large study population.
An example of a cross-sectional study is one by Love et al., which used a national database representative of the non-institutionalized civilian US population, the National Health and Nutrition Examination Survey. It found that the prevalence of metabolic syndrome was 40% among psoriasis cases, compared to 23% among controls. After adjusting for age, sex, race/ethnicity, smoking status, and C-reactive protein levels, the OR for the association between psoriasis and metabolic syndrome was 1.96 (95% CI 1.01–3.77). Therefore, patients with psoriasis had a 1.96 times or 96% greater odds of having metabolic syndrome, as compared to those without psoriasis.
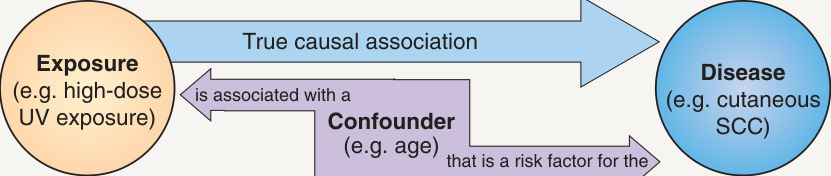
Fig. 123.2 Confounding. The blue arrow represents a true association, in this case a causal one. The purple arrow does not represent a true association, but one found because of confounding. SCC, squamous cell carcinoma; UV, ultraviolet radiation.
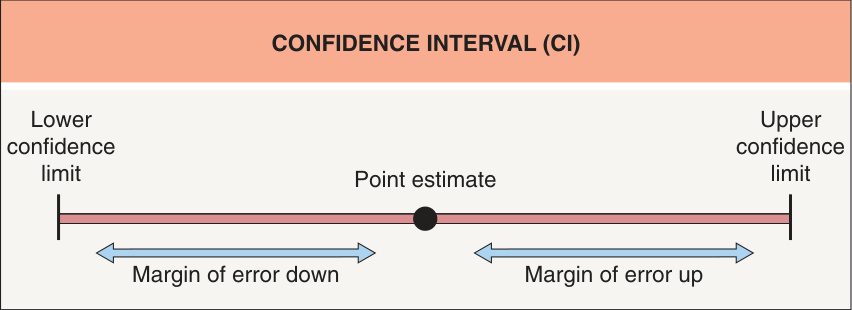
Fig. 123.3 Confidence interval (CI). A confidence interval derived from a valid analysis will, over unlimited repetitions of the study, contain the true parameter 95% of the time.
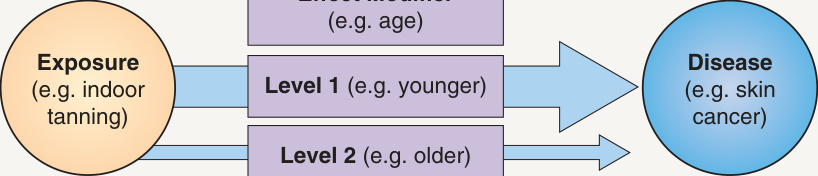
Fig. 123.4 Effect modification. The blue arrow represents a true association, in this case a causal one; the thicker it is, the stronger the association. If a variable causes effect modification, the strength of the association between exposure and disease varies across levels of the effect modifier. In some cases, there may not be an association for a given level of the effect modifier. Age is an effect modifier for many conditions. Interaction represents a similar concept that occurs when the exposure and another variable are interdependent in their effect on disease. MI, myocardial infarction.
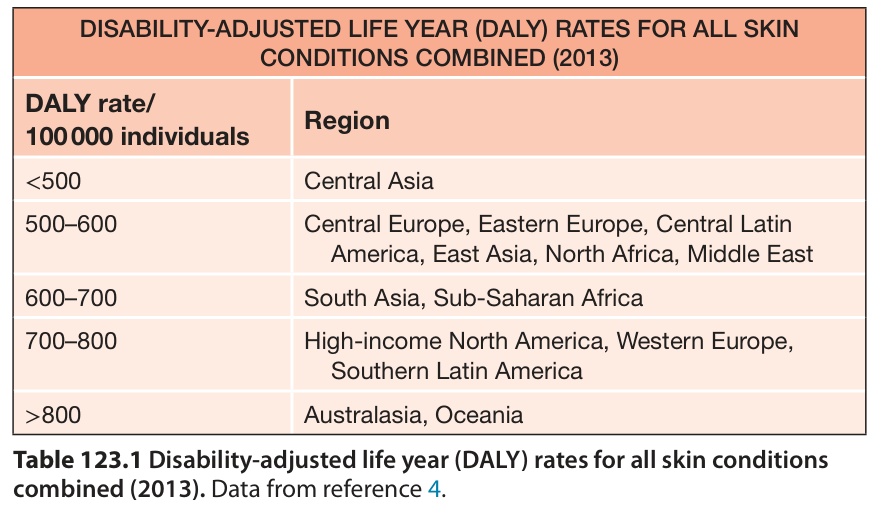
Table 123.1 Disability-adjusted life year (DALY) rates for all skin conditions combined (2013). Data from reference 4.
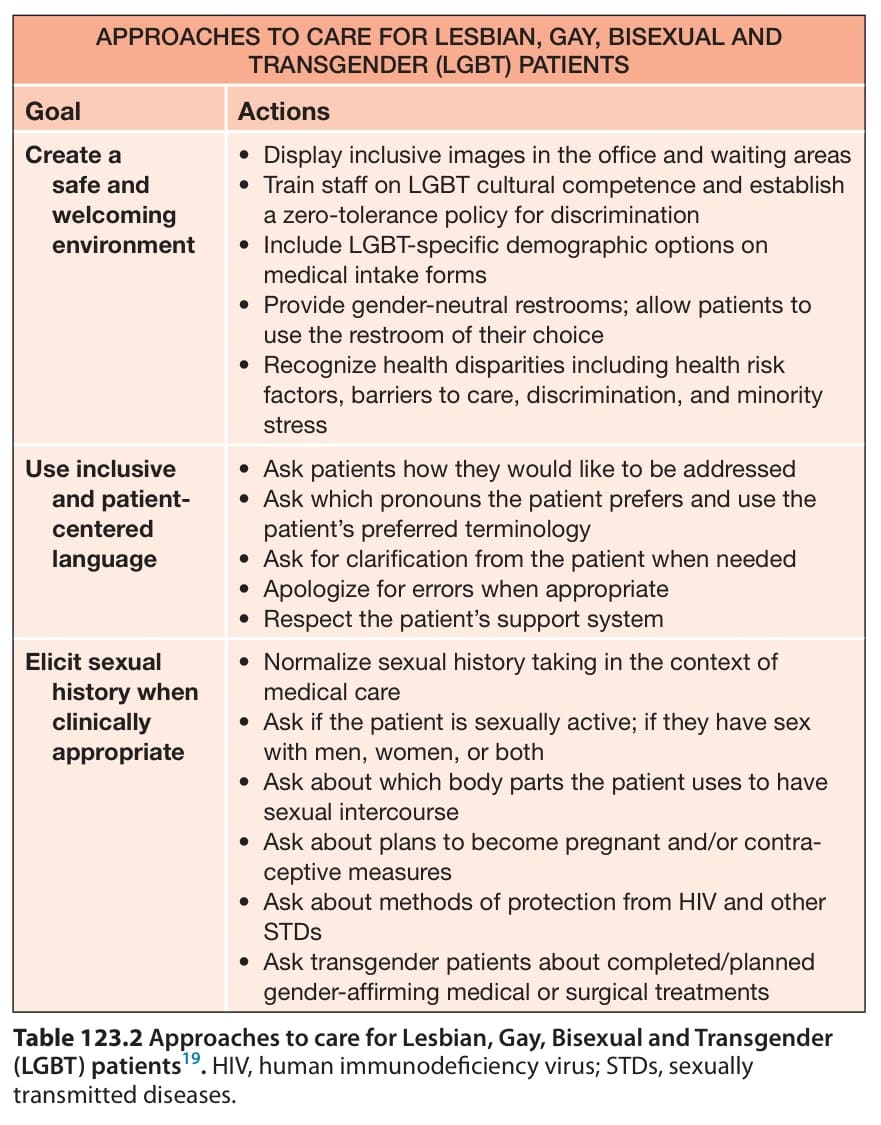
Table 123.2 Approaches to care for Lesbian, Gay, Bisexual and Transgender
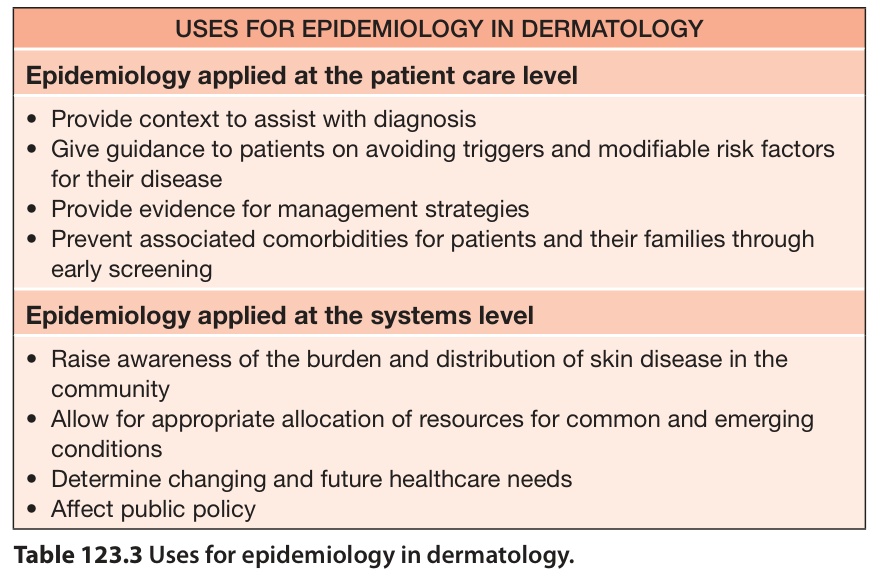
Table 123.3 Uses for epidemiology in dermatology.
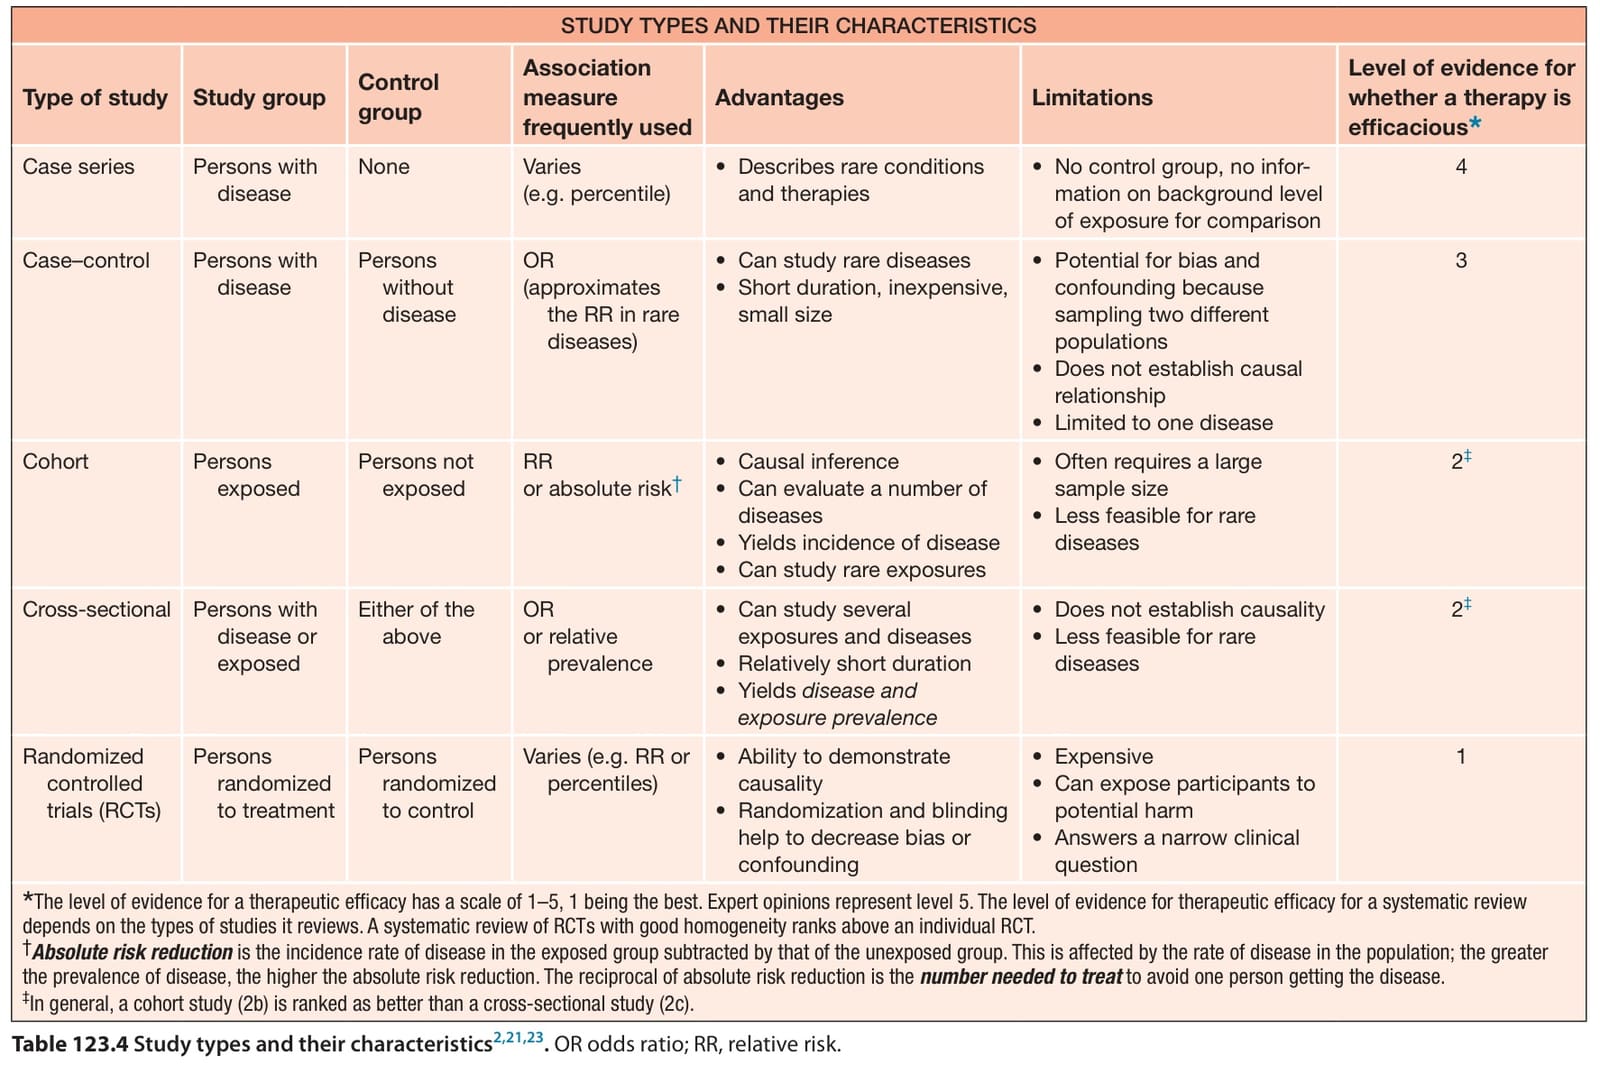
Table 123.4 Study types and their characteristics. OR odds ratio; RR, relative risk.
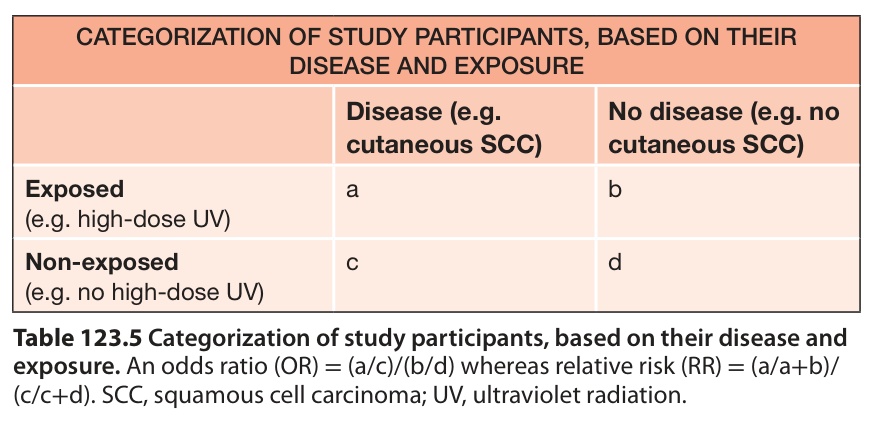
Table 123.5 Categorization of study participants, based on their disease and exposure. An odds ratio (OR) = (a/c)/(b/d) whereas relative risk (RR) = (a/a+b)/ (c/c+d). SCC, squamous cell carcinoma; UV, ultraviolet radiation.